


A sales forecast is how much you expect to close in a period, calculated with the data already sitting in your pipeline. The most widely used method is the weighted forecast: multiply the value of each deal by the close probability of the stage it is in, and add it up. You need three things and only three: the value, the stage with its percentage, and the expected close date. Not a spreadsheet with twenty tabs, and not an algorithm. This article gives you the calculation step by step, a worked example with numbers, and the five faults that stop your forecast from ever adding up.
What is a sales forecast, and what is it actually for?
It is an estimate of the revenue you will close in a specific period, based on the real state of your open deals. It is not a target. The target is what you want to sell; the forecast is what the data says you are going to sell. Confusing the two is the origin of half the uncomfortable end-of-month meetings.
It serves three decisions you cannot take by eye: how many people you hire, how much you invest in acquisition, and what you tell whoever asks you for numbers. And it serves a fourth one almost nobody mentions: spotting in the second week of the month that you are not going to get there, while there is still time to do something about it.
Careful with assuming everybody already does this well. In Gartner’s State of Sales Operations Survey, whose press release dates from February 2020, only 45% of the leaders and sellers surveyed said they had high confidence in the accuracy of their organisation’s forecast. Fewer than half. And in that same survey, 47% believed their organisation handled quality data. The figure has a few years on it now, but it points at something that has not changed: the problem is almost never the formula, it is the data you feed it.
The three inputs you need before you calculate anything
Before you touch any formula, check that you have these on every open deal. If one is missing, the result is decorative.
- The value. What the deal is worth if it closes. If you sell subscriptions, decide once and for all whether you work with the monthly or the annual figure, and do not mix them. Mixing them is the fastest way to inflate a forecast without noticing.
- The stage, with its probability percentage. Every stage of your process carries a percentage saying how many of the deals that reach it end up won. That percentage comes out of your own history. Not out of your intuition. I will come back to this in a minute, because it is where everything breaks.
- The expected close date. It determines which month each deal lands in. Without it you are not forecasting a period, you are adding up everything you have open, which is an entirely different thing.
If you do not have a sales process with defined stages, start there: it helps to be clear first on what a commercial department is and how it is structured. Without stages there are no probabilities, and without probabilities there is no weighted forecast.
How to build the weighted forecast step by step
The weighted forecast formula
Forecast for the period = Σ (deal value × probability of its stage)
Only deals whose expected close date falls inside the period you are forecasting go into the sum.
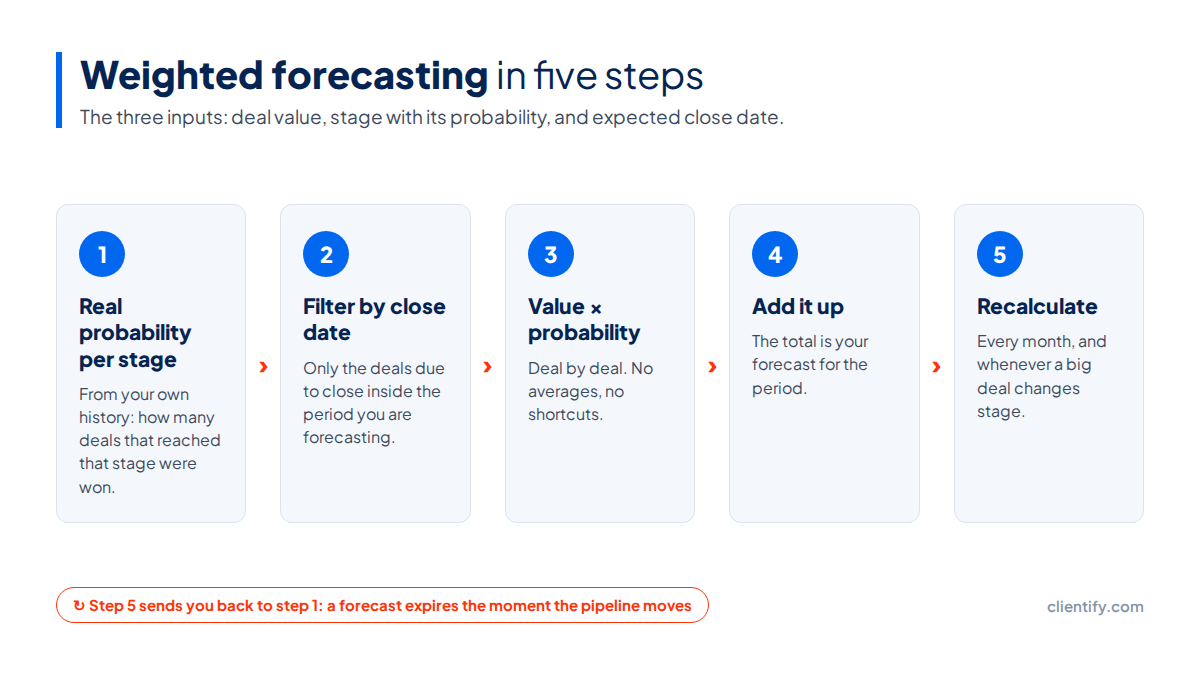
Step 1. Calculate the real probability of each stage. Take the deals from the last twelve months that passed through a given stage and look at how many ended up won. Forty went through “Demo done”, sixteen were won: that stage is 40%. Repeat for all of them. This step is boring and it is the only one that genuinely matters.
Step 2. Filter by expected close date. You keep only the deals whose date falls inside the month you are forecasting. October deals do not go into the September forecast no matter how advanced they are.
Step 3. Multiply value by probability. Deal by deal. There is no shortcut and no average that works here.
Step 4. Add it up. That is your forecast.
Step 5. Recalculate. Once a month at minimum, and whenever a big deal changes stage. A forecast from three weeks ago describes a pipeline that no longer exists.
It reads better with numbers:
| Deal | Value | Stage | Probability | Weighted value |
|---|---|---|---|---|
| Vega Consulting — annual plan | €12,000 | Proposal sent | 60% | €7,200 |
| Bermejo Workshops — 5 licences | €3,600 | Demo done | 40% | €1,440 |
| South Clinic — rollout | €18,000 | Negotiation | 80% | €14,400 |
| Doña Ana Printworks | €2,400 | First contact | 10% | €240 |
| Loma Distribution | €7,500 | Demo done | 40% | €3,000 |
| Total | €43,500 | — | — | €26,280 |
Look at what happens there: you have €43,500 in the pipeline and a forecast of €26,280. That difference is exactly the point. Nobody collects the whole pipeline, and whoever builds their plan on the gross figure gets an unpleasant surprise every month.
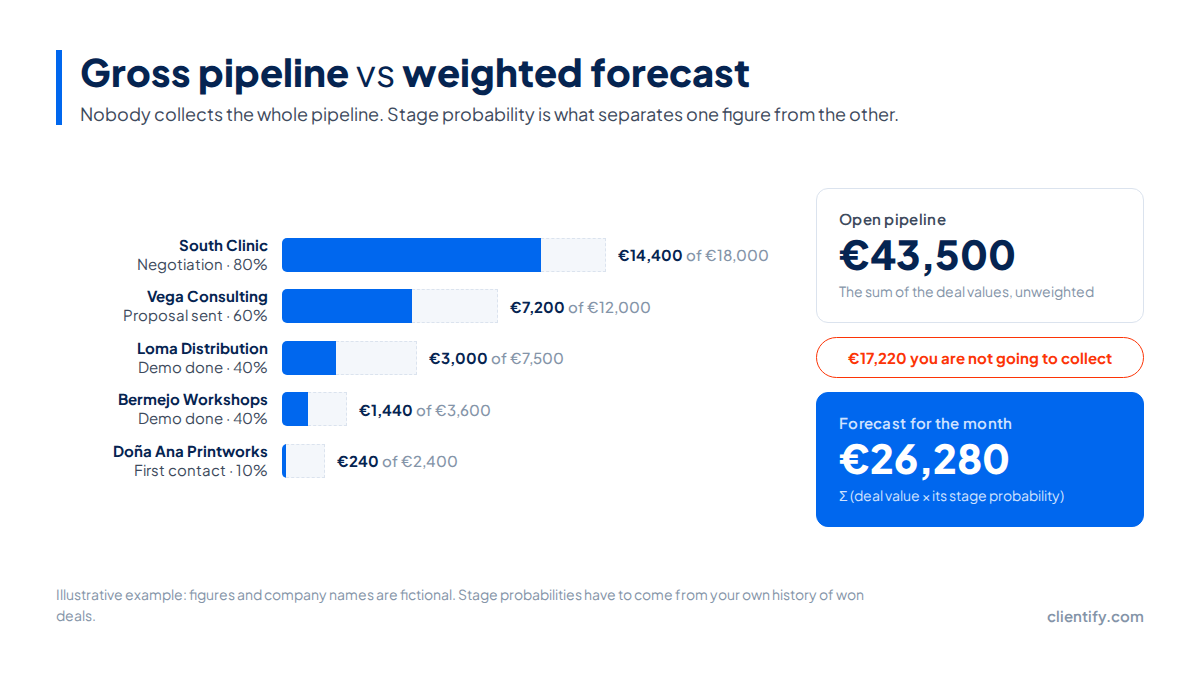
And notice something else, which shows up better in the chart than in the table: most of the forecast rests on two deals. If either of those two falls, the three small ones are not saving the month.
Three forecasting methods, and when each one is used
The weighted method is the one that works best for most SMBs, but it is not the only one and it is not wise to use it alone. The sensible thing is to cross-check two and see whether they give similar answers; when they diverge a lot, there is something there worth looking at.
| Method | Data it needs | When to use it | Where it breaks |
|---|---|---|---|
| Weighted by stage | Deal value, stage, and the close rate of each stage taken from your history | A pipeline with stable stages and enough deals for the percentage to mean something | If you make the probabilities up, what you have is an opinion with decimals |
| Historical | Real closings for at least the previous twelve months | A seasonal, stable business, as a cross-check on the weighted method | It is blind to whatever has changed: new product, new market, new team |
| By cycle length | Creation date and close date of the deals you have won | Long cycles that resemble each other, when what you need to know is the when | It tells you when you will close, not how much: it accompanies the weighted method, it does not replace it |
The five faults that stop your forecast from adding up
- Made-up probabilities. Somebody put 25 – 50 – 75 – 90 because it looked tidy and there they still are three years later. If the percentages do not come out of your history, everything else is wasted effort.
- Zombie deals. They have spent seven months in “Negotiation” at 80% and nobody has spoken to the customer since March. Every zombie adds noise to the forecast month after month. Close them as lost. Seriously. If they pile up because nobody chases them, the fix is upstream: automate the follow-up so a deal does not go quiet for a quarter without anyone noticing.
- Close dates nobody updates. The rep put “30 June” in February and nobody has touched it since. With a rotten date, the filter in step 2 filters nothing.
- End-of-quarter optimism. When the target starts to bite, deals advance stages on their own. No meeting, no proposal, nothing. If your close rate per stage collapses in the good months, you already know what is going on.
- One single forecast for different businesses. If you sell to small companies and to large enterprises through the same funnel, your percentages are an average of two realities that look nothing alike. Separate the processes and calculate each one on its own.
None of this is fixed with a better tool. It is fixed with data hygiene. Full stop.
How sales forecasting works in Clientify
Clientify does not predict the future for you: it gives you the three inputs properly recorded and the report to read them, which is what the method needs.
In Settings → Customisation → Deals you build your sales process with the stages you actually use and, on each one, you set its probability percentage. That percentage is what feeds step 1, and you have it where the selling happens instead of in a separate sheet somebody has to remember to update.
Every deal stores its value and its expected close date, so the period filter in step 2 is a filter, not an archaeology exercise. And if you need to record something else — a forecast value distinct from the closed one, the industry, whatever it is — you create a custom deal field.
To read it, the deals report lets you filter by period, by user and by sales process, and see deals spread across stages, the conversion funnel, the loss reasons and the seller ranking. With that you get the step 1 probabilities without exporting anything anywhere. And if what you want is to see the conversations behind each deal in the same place, that is what the multi-agent CRM inbox is for.
And if today you keep all this in a spreadsheet? The formula will work for you just the same; what will not work is the upkeep. That jump is covered in real alternatives if your sales team still works in Excel.
Frequently asked questions
How often should you redo a sales forecast?
Once a month at minimum, and whenever a large deal changes stage. A forecast is not a document you sign in January: it is a snapshot of the pipeline that expires the moment the pipeline moves. If your sales cycle is short, review it weekly.
What probability should I assign to each pipeline stage?
The one your own history says, not the one that feels reasonable. Count how many deals that passed through that stage were eventually won and divide by the total that passed through it. If you lack enough history, start with an estimate and correct it after three months of data.
Can you build a sales forecast in a spreadsheet?
Yes, the formula is the same. The problem is not the calculation, it is the upkeep: in a spreadsheet somebody updates the stage and the value by hand, and that person forgets. In a CRM the forecast recalculates itself because the data already lives where the selling happens.
Why is my forecast always higher than actual sales?
Almost always for two reasons: zombie deals that have sat in an advanced stage for months without moving, and expected close dates nobody has updated. Clean up both before you touch the probabilities and you will see the gap between forecast and real closings shrink considerably.
What is the difference between pipeline and sales forecast?
The pipeline is everything you have open: the sum of the values of your live deals. The forecast is how much of that you genuinely expect to collect in a period, after applying each stage probability. The pipeline is the gross figure; the forecast, the expected net.
Next step
You have the whole method: real probability per stage, filter by close date, value times probability, add it up and recalculate monthly. What is left is having the data somewhere it maintains itself.
Build your sales process and see what forecast comes out
7 days free, no card. In one afternoon you have your stages with their percentages and the first forecast on the table.
Try Clientify for free